
Negin Abaeian
Department of Music Technology
Schulich School of Music, McGill University
Modeling the Diatonic Harmonica
A literature review
I. Summary of the Objectives
Diatonic Harmonica is an instrument whose working principle relies on the self-excitation of its free reeds. The purpose of this project was to explore the dynamics involved in production of the rich harmonic content of the sound of the diatonic harmonica, present a physical model for the instrument, and to compare the results of the presented model with those obtained experimentally. The objectives were fulfilled by reviewing the two following papers:
A. Experimental Results when Playing Chromatically on a Diatonic Harmonica (Millot et al. 2001) [1]
B. Time Domain Simulation of the Diatonic Harmonica (Debut et al., 2004) [2]
A. Experimental Results when Playing Chromatically on a Diatonic Harmonica (Acta Acustica 2001)
Objectives
The objective of this paper is to study the reeds' motion and the relative inner pressures in the three modes of playing on a diatonic harmonica.
Methodology
In a study done by Bahnson et al. [3], the motion of the reeds, reed primacy, acoustical and physical dynamics of the reeds were studied in the three different modes of playing – i.e. normal blow/draw, bending and overblow/overdraw referred to as overnotes. The reed displacement measurements in [3] were obtained using proximity sensors, which have high levels of nonlinearitiess. This is why Millot et al. have monitored the motion of the reeds using strain gauges instead. This has been done by locating a pair of strain gauges (each pair of which creates a half Wheatstone bridge), on each of the two reeds inside channels 4 and 7, simply because it is easier to achieve bendings and overnotes on these two channels.
In this study, however, it is not only the motion of the reed that has been of importance. Millot et al. [2] take a step further and monitor the pressure changes inside channels 4 and 7 during the different modes of playing, and it is by focusing on the pressure variations that they are able to explain the behavior of the reeds and the pitch production in the instrument.

Figure 1: Configuration of the appartus used in [1]
In the apparatus used, the harmonica is a G harmonica and the microphone is meant to measure the outer pressure, and the pressure transducer measures the inner pressure.
As expected, addition of the strain gauges affected the mass, stiffness, damping factor and hence the motion of each reed, which is why the player had to get used to the new pitch production of the instrument prior to playing. This also means that the stiffness, mass and damping values had to be calibrated for the physical model that is to be introduced later in [2], and the calibration equations are as follows:

where Qn is the quality factor, and is a characteristic of the reed (i.e. the n'th reed).
Discussion of the Results
Simultaneous displacement profiles of the reeds and the pressure changes while playing need to be discussed.
Normal Blow on Channel 4
For a normal blow on channel 4, normalized power spectrum of the upper reed oscillation (i.e. fourier transform of the displacement profile over 18 ms, reported in percentage of the maximum power) has been reported below. On the other hand, power spectrum of the inner pressure changes in this channel (i.e. fourier transform of the pressure profile over time) reveals that even though both have the same harmonics components, power of those produced by the pressure variations is way higher than those produced by the reed motion, and that reveals importance of the pressure changes inside a channel in production of the sound, as opposed to the reed motion.
Upper and lower (i.e. blow and draw) reed opening and closings have been related to the rise and fall of inner pressure over time, such that the maximum pressure increase is associated with when the two reeds are located at the least height from their respective slot (i.e. least opening/closing), i.e. stage e in Figure 3.


Figure 2: Normalized power spectrum of the upper reed motion for a normal blow on channel 4 (left), Normalized power spectrum for the internal pressure during a blow on channel 4 [1].
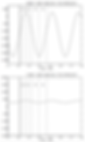

Figure 3: Upper and lower reed displacements,
normalized internal pressure power spectrum during a normal blow in channel 4. [1]
Draw Bend on Channel 4
Higher hormanics in the power spectrum of the pressure changes during a draw bend were seen to have lower magnitudes compared to those in the normal blow (as seen in the left plot in Figure 2), which is one explaination for why it is more difficult to produce and sustain a pitch through bending on a Harmonica, than through a normal blow/draw.

Figure 4: Normalized power spectrum for the internal pressure during draw bend on channel 4 [1].
Reed displacemets in case of a draw bend were seen to be out of phase, which is why reed opening and closings are not able to create pressure spikes (in time domain) as sharp as those observed in a normal mode of playing. One thing else that can be noticed is that deflections of both the upper and lower reeds were seen to have amplitude ranges higher than those in a normal blow (meanng they were both 'active'), whereas in a normal blow only the blow reed was active.
Note that in the draw bend, the period of both the pressure and deflection profiles are shorter than those in a normal blow (around 2.5 ms compared to the normal blow which is 3 ms), and that is because the pitch produced through a draw on channel 4 is higher than that produced through a blow.
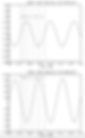

Figure 5: Upper and lower reed displacements,
normalized internal pressure power spectrum during a draw bend on channel 4. [1]
Overdraw on Channel 7
As the strain gage attached to the lower reed broke during the overdraw, the plots reported for the case of an overdaraw on channel 7 are only the pressure power spetrum, as well as the upper reed deflection and pressure variation over time. Higher harmonics produced in this mode of playing are seen to have higher power compared to those produced in a draw bend, and the source of that can also be seen in the pressure variation spikes over time too (i.e. sharper than those produced in a draw, but smother than those observed in a normal blow).

Figure 6: Normalized power spectrum for the internal pressure during an overdr 7 [1].
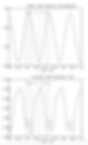
Figure 7: Upper and lower reed displacements,
normalized internal pressure power spectrum during an overdraw on channel 7. [1]
Conclusions of the Study
Studying the motion of the reeds and the inner pressure signals simultaneously demonstrated the importance of the role of the active reed(s) on the pressure variation and hence the pitch produced. Furthermore, the sharp peaks in the inner pressure profiles over time explain the rich harmonic content of the sound produced by the harmonica. Finally, as the reeds motion was seen to be sinusoidal at all times, the authors believe that it is the non-linear character of the flow through the reeds that leads to the nonlinear harmonics in the sound.

Figure 8: Vocal tract configuration using a four-cylinder combination: supply area (1), palatal constriction (2), fron cavity (3), lippal and harmonica channel (4), and outside (5). [2]
Comparison with the Experimental Results
Once the numerical systems were generated and the pressure drop values (del-p4) were obtained thorugh discrete-time simulations, the variations of the inner pressure over time and the Fourier transform of them (that lead us to the power spectrum of the pressure variations) were obtained. The pressure variations generated were then qualitatively compared to those obtained experimentally for the two cases of normal blow and overblow on channel 4 of a G harmonica. The generated results were seen to follow a regime close to the ones observed experimentally, though with slightly differet amplitudes, which can perhaps be due to losses due to riction and experimentation devices.
Conclusions of the Study
A one-dimensional physical model was presented for the diatonic harmonica. Using discrete-time simulation, the nonlinear differential equations associated with the incoming and the outgoing air flows determined the pressure drop from the upstream (from the vocal tract) to the downstream (inside the channel), as well as the motion of the reeds in equation (1). The generated pressure variation and reed deflection results were compared to those obtained experimentally, and th generated results were seen to follow the same regime as the experimental results.


Figure 9: On the left: comparison of the experimental pressure drop (del_p4) for a blown note on channel 4 of a G harmonica (top left: experimental, bottom left: numerical simulation).
On the right: pressure drop comparison on an overblow on channel 4 of a G harmonica (top right: experimental, bottom right: numerical simulation). [2]
B. Time Domain Simulation of the Diatonic Harmonica
As explained by Schumacher [4], in instruments whose working principle is highly dependend on the non-linear behavior of some of their parts, time domain simulation of instruments is found to be beneficial when used complimentary with frequency domain discription. The time-domain model proposed by Schumacher, however, cannot be used for a diatonic harmonica, for the very fact that the nature of their working reeds are completely different. Inside each hole (referred to as channel) of a dianotic harmonica, there are two reeds that interact via the air flow inside the channel, as opposed to a Clarinet or a Saxophone that work with one reed that hits the body of the mouth piece, and where the description of their resonator body is linear. In the case of a diatonic harmonica, a nonlinear behavior is reported and modeled in the incoming pressure (i.e. through the vocal tract), as well as the air volume flow through the reeds due to the interaction of the two reeds (causing the impedance formulation used in [4] to not be valid).
In this section, we will go over the information included in [2], which focuses on the time domain simulation of the diatonic harmonica, by proposing a physical model that is eventually compared to the ressults found in [1]. The effective model consists of a set of four equations:
-
Two linear differential equations describing the two reeds' motions (based on the fact that the motion of the reeds is almost perfectly sinusoidal around their first eigen mode). Considering each reed to be a one-degree of freedom damped oscillator, the displacement of the tip is described as follows:
Where
Mn, Rn and Kn are the mass, damping coefficient and the stiffness of the nth reed
hn-hn00 represents the vertical displacement of the reed with respect to the initial location of the reed at rest
Sr is the effective hydrodynamic area
And del_p4 is the pressure from the lippal area to the harmonica channel (Figure
-
Two non-linear equations concerning the input and the output air flows:
I: The output airflow (firstnon-linear equation) consists of two contributing components, one for the volume flow through the reeds, Utn, and one for the flow induced by the reeds movement, Uan. The second non-linear equation belongs to the input airflow which is derived from the description of the vocal tract.

Flow through the reeds:


The induced flow:

where
alpha is the vena contracta coefficient
Sn(hn) is the useful section through which the flow excapes the harmonica
And v5 is the air flow velocitiy in element 5 (where element 5 is the 5th part of the vocal tract model)
The description of the vocal tract follows the model proposed by Fant [5], which makes use of three parameters, namely the constriction area (region 2), the position of the center of constriction, and the length of the 4th and 5th regions which correspond to the lippal region and the harmonica channel. The principles used in describing the vocal tract and the incoming flow make use of the mass conservation for the air pressure flow from region 3 to region 4, assuming incompressible and instationary flow which allows use of the Bernoulli equation for the constriction area (region 2) and the lippal area (region 4). Inherently, the explained description is non-linear, therefore to carry out the pressure and flow calculations, the authors have discretized the equations obtained (using the bilinear transform) into a numerical system which follows an iterative approach. The obtained non-linear differential equations for pressure change and volumetric flow are then solved using the backward Euler method and Newton Raphson methods.
In this literature overview, however, the details of the vocal tract modeling will not be explained, as the focus of the paper is on giving an overal framework for the instrument's time-domain simulation. The mathematical details of the model can be found in the appendix section of a third study by Millot et. al titled as: A proposal for a minimal model of free reeds [6].
For the above numerical system, the excitation signal was chosen from the previous experiments, and the initial conditions and vocal tract configuration were chosen. The above comprehensive model is therefore capable of describing and producing the motion of the reeds, as well as the playing frequency and the inner pressure signals.
Challenges
The main difficulty I faced while conducting this literature review was that both studies lacked mathematical and specification details. This required me to refer to almost all the references listed in the studies and one that was published later by the authors, in order to fully understand the procedure they had used as well as the specifications used in the experiments. I found this procedure to be a lot more time consuming than I had expected and hence exhaustive for a course project. Also, since this study was a literature review and not a primary study, it was difficult to reflect all the information gathered in the report.
Other than that, there were numerous inconsistencies between all the papers by Millot et al. which made it difficult to relate the variables and concepts discussed.
References
[1] L. Millot, Ch. Cuesta, C. Valette. 'Experimental Results when Playing Chromatically on a Diatonic Harmonica', Acta Acustica, vol. 87, no. 2, pp. 262-270, 2001.
[2] V. Debut and L. Millot. 'Time Domain Simulation of the Diatonic Harmonica', Journal of the Acoustical Society of America, 2004.
[3] H. Bahnson, 'Acoustical and physical dynamics of the diatonic harmonica', The Journal of the Acoustical Society of America, vol. 103, no. 4, p. 2134, 1998.
[4] M. McIntyre, R. Schumacher, J. Woodhouse. 'On the oscillations of musical instruments', The Journal of the Acoustical Society of America, vol. 74, no. 5, p. 1325, 1983.
[5] G. Fant. Acoustic Theory of Speech Production: With Calculations based on X-Ray Studies of Russian Articulations. Mouton, The Hague - Paris, 2d edition, 1970.
[6] Millot and C. Baumann, 'A Proposal for a Minimal Model of Free Reeds', Acta Acustica united with Acustica, vol. 93, pp. 122-144, 2007.